In last two articles, we have learned how to capture deadlock using SQL Server Profiler and Tracing deadlock with Trace Flag 1222 and Trace Flag 1204. Now in this post we are going to learn a very useful method of tracing deadlock with Extended Events. These events are less resource intensive and light weight in comparison of SQL Server Profiler. We use these events to capture interested information to be analyzed now or later from heavy load servers (Like production server).
If we don’t have any clue about deadlock being occurred in midnight at our production server and because of heavy load on server, we can not use SQL Server Profiler their. Extended events are very useful because of very few resource utilization. We can create a session and start it to capture only those events in which we are interested. Extended events are very useful in such types of scenarios like capturing data from production server.
Extended Events
What is extended events?
Extended events is a performance monitoring tool introduced in SQL Server 2008, which uses very few resources and provides very high configurable architecture. It allows to configure itself in any way so that user can collect all or only selective information as needed. It is very useful tool to be used on production server.
Initially this tool had no GUI and could be set from complex code but from SQL Server 2012, with an introduction of GUI, this is a preferred tool for gathering query performance metrics among other tools.
It takes very few resources in comparison of other performance monitoring tools like SQL Server Profiler and Traces. SQL Profiler and Traces were used previously to capture performance metrics is going into depreciation and may be on it’s way out path.
We can start Extended events in either ways; using GUI or by calling procedures too.
Using Extended Events to trace Deadlock
To start with Extended Events using GUI tool follow below steps;
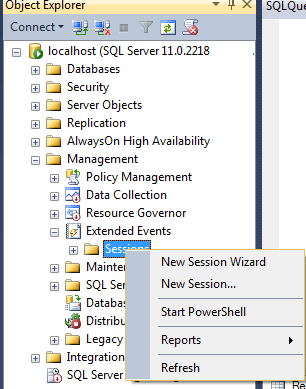
- Go to – Object Explore -> Management -> Extended Events.
- Click on + sign preceding “Extended Events”.
- Right Click on “Sessions” folder and select “New Session Wizard”.
- New Session wizard dialog box will appear with “Introduction” tab selection.
- Click on “Next” button at bottom right corner.
- On “Set Session Properties” page, put session name as “DeadlockEvent” and click next.
- On “Choose Template” page, Select “Do not use a template” option and click on next button.
- On “Select Events to Capture” page, go to Event library text box and type deadlock. All the events related to deadlock will be filtered out, now by pressing Ctrl key, click on events “lock_deadlock”, “lock_deadlock_chain” and “xml_deadlock_report”.
- Now click on red circled > button and then click on Next button again.
- On “Capture Global Fields” page, mark fields as you need to be captured for your information and click next. In this demo i have marked client_app_name, database_id, database_name, plan_handle, process_id, session_id, sql_text, tsql_frame, tsql_stack, username fields.
- On “Set Session Event Filters” page, you can put any filter if required. In our case i am avoiding this and going to click on next.
- On “Specify Session Data Storage” page, specify your preferred storage. In this demo i am going to use a file to store the data. Click on browse button and select your location to store the file in case you want to change the location. You can also set max file size and total number of files to store all these information. Click on next.
- On “Summary” page, you also have an option to generate the T-SQL Script, for what you have configured here. Click on next.
- Click on Finish button now. Click on close button.
Once you have done all the above steps. We can see your Session name DeadlockEvent inside Sessions folder in Object Explorer -> Management -> Extended Events -> Sessions.
Right click on your Session name and click on Start session button. Alternatively you can also mark it on final screen and then click on close button.
Once you have started the session, again right click and select “Watch Live Data” from pop up menu then create an artificial deadlock as discussed in the section “How to create a demo purpose deadlock?” in post Tracing deadlock in sql server profiler.
Output of Extended Event
Now have a look on xml_deadlock_report result below;
All the details are available in the output.
There is another way to get these details from extended events instead of “Watch Live Data”
SELECT * FROM
SYS.fn_xe_file_target_read_file
('C:\Program Files\Microsoft SQL Server\MSSQL11.MSSQLServer2012\MSSQL\Log\DeadlockEvent*.xel', NULL, NULL, NULL)
Replace your file name as you have Put for extended event storage file name.
Thanks for your interest in us and please continue this to encourage us. If you like this post, do share on your social media and don’t forget to rate this article. Please put your comments below on “Tracing deadlock with Extended events”.


